← All 50 books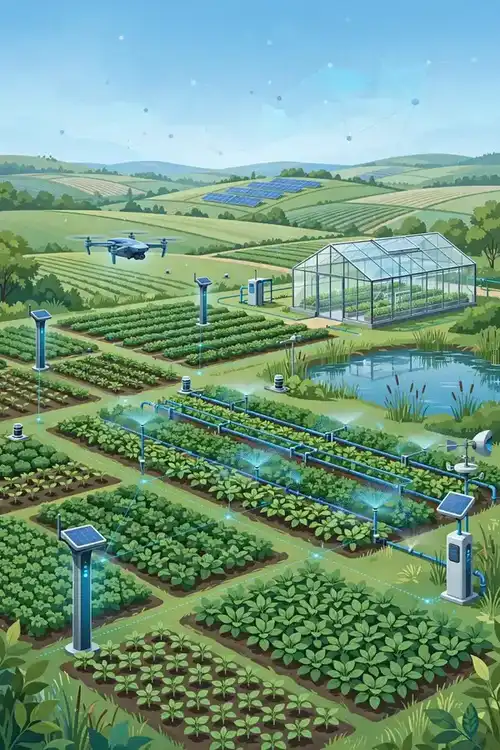
Book 35 of 50 · Free
Smart Agriculture with IoT
2,764 words · 17 chapters · illustrated
Book 35 of 50 · Free
2,764 words · 17 chapters · illustrated
Book 35 of 50 — AstolixGen Learning Series For researcher and publication students
Agriculture feeds the world and wastes the most water doing it. IoT turns guesswork into measurement: soil moisture, microclimate, crop health, and livestock — sensed continuously, acted on precisely. This book covers the full stack from soil physics to published field trials: sensors that survive the field, connectivity for rural areas, irrigation control, disease detection, and how to run an agricultural experiment with the statistical rigor reviewers demand.
Learning objectives: - Select sensors for soil, climate, and crop monitoring - Design rural connectivity (LoRa, cellular, satellite trade-offs) - Build closed-loop irrigation control - Apply disease/pest detection with field-collected data - Design agricultural field trials with proper controls - Measure water, yield, and cost outcomes honestly - Publish applied agri-IoT research
Agriculture uses ~70% of global freshwater, yet most irrigation is scheduled by calendar or gut feeling — over-watering some zones, stressing others. Fertilizer is applied uniformly though soil varies meter by meter. Pests are found by walking fields. The result: wasted water, wasted inputs, lost yield, and environmental harm. IoT's promise is precision: measure each zone, act only where needed.
The research case is strong because the outcomes are physical and measurable: liters of water, kilograms of yield, rupees of cost. Unlike many IoT domains, agriculture gives you ground truth that reviewers trust. The challenge is the environment: no power, no connectivity, dust, heat, rain, and equipment that must survive seasons unattended.
Example: A 2-hectare vegetable farm: soil-moisture sensors per zone + automated valves. Irrigation water dropped 38%, yield rose 12% (less waterlogging), and the system paid for itself in one season. Every number measured, not modeled.
For your research: Agricultural papers live or die on measured outcomes vs a control plot. "We saved water" needs a side-by-side control with the same crop, soil, and weather.
Key takeaway: Precision agriculture = measure per zone, act per zone; outcomes are physical and must be measured against controls.
Soil moisture is the highest-value measurement. Capacitive sensors (cheap, no corrosion) beat resistive ones (corrode in weeks) for long deployments. Install at root depth (15–30 cm for vegetables), multiple depths for research. Calibrate: raw ADC values mean nothing without a soil-specific calibration (gravimetric samples at install).
Soil temperature affects germination and disease; cheap DS18B20 probes in waterproof housings work. Nutrients (N/P/K) remain hard: lab tests are accurate but slow; ion-selective field sensors drift and need frequent calibration. Honest papers report nutrient-sensor drift rather than hiding it.
Example: Capacitive sensor calibrated: ADC 520 = 12% VWC (wilting), ADC 780 = 28% VWC (field capacity) for a loam plot. Irrigation triggers at 18% VWC, stops at 26% — a closed loop built on two calibrated numbers.
For your research: Publish your calibration curves and drift measurements. Sensor characterization in field conditions is itself a citable contribution.
Key takeaway: Capacitive moisture + calibration at root depth; report drift honestly, especially for nutrients.
A field weather station (temperature, humidity, rainfall, wind, solar radiation, leaf wetness) drives disease models and irrigation scheduling. Leaf wetness sensors are underused gold: many fungal diseases need N hours of leaf wetness to infect — the sensor directly measures the infection condition.
Placement matters: 1.5 m height, away from buildings, radiation shield for temperature/humidity. One station per 2–5 hectares is typical; microclimates vary, so research deployments use several.
Example: A late-blight warning: leaf wetness > 10 h + temperature 15–25°C → alert. The model (a simple rule from plant pathology) beat the farmer's calendar spraying, cutting fungicide applications from 9 to 4 per season with no yield loss.
For your research: Combine your sensor data with a published disease model (many exist per crop). "IoT + established pathology model" is a strong, defensible paper structure.
Key takeaway: Field weather + leaf wetness enables disease-risk models; place sensors per microclimate.
Fields lack Wi-Fi. LoRa/LoRaWAN gives kilometers of range at milliwatts but tiny data rates (tens of bytes per message, duty-cycle limited) — perfect for soil readings every 15 minutes, useless for images. Cellular (4G/NB-IoT) gives real bandwidth where coverage exists; NB-IoT is designed for exactly this (small data, deep sleep, 10-year battery claims). Satellite IoT (emerging) covers everywhere at high cost per message — for alerts, not streams.
Design rule: match message size × frequency to the link. Soil data over LoRaWAN: fine. Leaf images over LoRaWAN: impossible — process on-device (TinyML, Book 32) and send only the diagnosis.
Example: A 50-node LoRaWAN farm network: each node sends 24 bytes every 15 min (moisture, temp, battery). Gateway with 4G backhaul. Yearly data cost: one SIM. Image-based pest alerts run TinyML on ESP32-CAM nodes, sending only "pest suspected" flags via LoRa.
For your research: Connectivity comparisons (packet delivery vs distance/vegetation, energy per message) in real farm conditions are publishable measurement studies.
Key takeaway: LoRa for tiny periodic data, NB-IoT where covered, TinyML + tiny messages where neither fits images.
The killer app: sensors → decision → valves, automatically. Architecture: soil-moisture per zone → controller (threshold or model-based) → latching solenoid valves (they hold state without power — critical for battery/solar). Fail-safes: maximum runtime per day, manual override, and "if sensor dies, fall back to schedule" logic. A stuck-open valve floods; a stuck-closed one kills crops — design for both.
Scheduling strategies: threshold-based (simple, robust), evapotranspiration-based (FAO-56 Penman-Monteith using weather data — the agronomic gold standard), and model-predictive (uses forecasts). Start with thresholds; graduate to ET-based.
Example: Drip zones with threshold control (18–26% VWC) vs farmer's timer schedule, side by side, same crop: 38% less water, 12% more yield, zero waterlogging events. The control plot is what made it publishable.
For your research: Irrigation papers need: control plot, same cultivar/planting date, measured water (flow meters, not estimates), and at least one full season. One season is the minimum credible unit.
Key takeaway: Closed-loop irrigation with fail-safes; evaluate against a control plot over a full season with metered water.
Two approaches: image-based (leaf photos → CNN; see Book 32 for TinyML deployment) and risk-model-based (weather + leaf wetness → infection warnings). Image models need field-collected training data — lab datasets (like PlantVillage) underperform in the field due to background, lighting, and occlusion differences. Collect your own field images; it's laborious and it's the moat.
Critical honesty: report field accuracy, not lab accuracy. A model at 96% on PlantVillage may score 78% on your farm's photos. The gap itself is a finding — domain shift in agricultural vision is an active research area.
Example: Tomato early-blight detector: 3,200 field photos across 2 seasons, int8 model on ESP32-CAM at the plot edge, 84% field accuracy, alerts via LoRa. Failure analysis: worst in heavy rain (droplets) and on shaded leaves — published as limitations, became the most-discussed section.
For your research: Field-collected datasets are publishable artifacts. Release yours (with licenses) — the community rewards it with citations.
Key takeaway: Field data beats lab data; report field accuracy and failure modes honestly; release datasets.
IoT for animals: health (rumination collars, temperature boluses detect illness days before visual signs), location (GPS/Lora trackers for grazing management), reproduction (activity spikes predict estrus), and milk (yield + conductivity per animal flags mastitis).
The economics are per-animal: a $40 collar must save more than $40 in vet costs, lost milk, or mortality. Research should include the economic analysis — farmers adopt on ROI, not accuracy.
Example: Dairy mastitis detection: milk conductivity + yield per cow, alert on deviation. Detected 78% of cases 2 days before clinical signs; treatment cost fell 60% (early = cheap). The paper's ROI table drove adoption.
For your research: Animal studies need veterinary collaboration and ethics approval — arrange both early. They also need baselines: compare against the farmer's current detection method.
Key takeaway: Livestock IoT = early detection + per-animal ROI; get vet collaboration and ethics approval early.
No outlets in fields. Solar + battery is the standard: size the panel for the worst month (monsoon/winter), not the average. Energy budget per node: sense (mJ) + compute (mJ) + transmit (J for LoRa, more for cellular) + sleep (µA × time). Duty-cycle aggressively: wake, measure, transmit, deep-sleep.
Example budget (LoRa soil node): measure 50 mJ + LoRa TX 120 mJ every 15 min + sleep 8 µA → average 0.35 mW. A 2000 mAh Li-ion + 5 W panel runs indefinitely in most climates; the panel is sized for 5 sunless days.
For your research: Publish the energy budget table and the sizing math. "Solar-powered" claims without the budget are not credible.
Key takeaway: Size solar for the worst month; publish the full energy budget.
Agricultural research demands field-trial discipline borrowed from agronomy. Randomized complete block design: divide the field into blocks, randomly assign treatment/control within blocks to cancel soil gradients. Replicates: minimum 3–4 per treatment — one plot each is anecdote, not science. Control: farmer's practice, not "nothing" — you must beat the status quo.
Statistics: report means with standard errors, use ANOVA or t-tests as appropriate, and pre-register your metrics (water, yield, cost) to avoid p-hacking. One season is minimum; two seasons handle weather variation.
Example: 4 blocks × 2 treatments (sensor irrigation vs timer) = 8 plots, randomized. Result: water −38% ± 6% (p < 0.01), yield +12% ± 5% (p < 0.05). The statistics section took one page and made the paper.
For your research: Consult an agronomist or statistician before planting, not after harvest. Trial design errors are unfixable post hoc.
Key takeaway: Randomized blocks, ≥3 replicates, farmer-practice control, pre-registered metrics, real statistics.
Farmers need dashboards, not databases. Requirements: offline-tolerant mobile app (fields have no signal — cache and sync), simple visuals (zone maps colored by moisture, not time-series spaghetti), alerts that respect attention (one actionable SMS beats 20 push notifications), and multi-language support.
Example: A dashboard showing each zone as green/yellow/red by moisture, one-tap valve override, and a weekly water report in the local language. Adoption: 80% of pilot farmers used it weekly; the previous "powerful" dashboard had 10% use. Usability is the metric.
For your research: HCI/agritech papers can study adoption: measure actual usage, interview farmers, report what they ignored. Negative results about fancy features are valuable.
Key takeaway: Build for offline, simplicity, and action; measure adoption, not just functionality.
Technology without economics is a demo. Cost model: hardware per hectare + installation + yearly maintenance + connectivity, vs benefits: water saved × price, yield gain × price, labor saved, input reduction. Payback period under 2 seasons drives adoption; over 3 seasons kills it.
Example: 2-hectare drip + sensors: $900 capex, $60/year opex. Benefits: $420/year water + $380/year yield + $150/year labor = $950/year. Payback: ~1 season. The paper's economics table was cited by three follow-up deployment studies.
For your research: Include the economics table. Reviewers and funders ask "who pays?" — answer before they do.
Key takeaway: Payback under 2 seasons; publish the full cost-benefit table.
Template:
Common rejections: no control plot, one season claimed as conclusive across climates, lab-only disease data, missing economics, uncalibrated sensors.
For your research: This is A1 (problem + lit review incl. agronomy literature) → A2 (trial + system design) → A3 (season results) → A4 (presentation). Start trial design months before planting.
Key takeaway: Control plot + calibration + statistics + economics + artifact = publishable agri-IoT.
| # | Chapter | Core idea | Research use |
|---|---|---|---|
| 1 | Why agri-IoT | Precision, measurable outcomes | Control-plot discipline |
| 2 | Soil sensing | Capacitive + calibration | Sensor characterization papers |
| 3 | Microclimate | Leaf wetness, disease models | IoT + pathology models |
| 4 | Connectivity | LoRa/NB-IoT match to data | Real-condition measurement studies |
| 5 | Irrigation | Closed loop + fail-safes | Season trials vs control |
| 6 | Disease detection | Field data, honest accuracy | Dataset artifacts, failure analysis |
| 7 | Livestock | Early detection + ROI | Vet collaboration, ethics |
| 8 | Power | Solar sizing, budgets | Published energy budgets |
| 9 | Field trials | Blocks, replicates, stats | Pre-registered, rigorous design |
| 10 | Farm platforms | Offline, simple, adoption | Usage/adoption studies |
| 11 | Economics | Payback < 2 seasons | Cost-benefit tables |
| 12 | Study template | Plot → paper pipeline | A1–A4 mapping |
[1] S. Wolfert, L. Ge, C. Verdouw, and M. J. Bogaardt, "Big Data in Smart Farming — A review," Agricultural Systems, vol. 153, pp. 69–80, 2017. [2] A. Kamilaris and F. X. Prenafeta-Boldú, "Deep learning in agriculture: A survey," Computers and Electronics in Agriculture, vol. 147, pp. 70–90, 2018. [3] L. Atzori, A. Iera, and G. Morabito, "The Internet of Things: A survey," Computer Networks, vol. 54, no. 15, pp. 2787–2805, 2010. [4] W. Shi et al., "Edge Computing: Vision and Challenges," IEEE Internet of Things Journal, vol. 3, no. 5, pp. 637–646, 2016. [5] J. Lin et al., "MCUNet: Tiny Deep Learning on IoT Devices," in Proc. 34th Conf. Neural Information Processing Systems (NeurIPS), 2020. [6] R. G. Allen, L. S. Pereira, D. Raes, and M. Smith, "Crop evapotranspiration — Guidelines for computing crop water requirements," FAO Irrigation and Drainage Paper 56, 1998. [7] S. P. Mohanty, D. P. Hughes, and M. Salathé, "Using deep learning for image-based plant disease detection," Frontiers in Plant Science, vol. 7, 2016. [8] World Health Organization, WHO Global Air Quality Guidelines, Geneva, 2021. (for environmental context) [9] R. Roman, P. Najera, and J. Lopez, "Securing the Internet of Things," Computer, vol. 44, no. 9, pp. 51–58, 2011. [10] H. Kopetz, Real-Time Systems: Design Principles for Distributed Embedded Applications, 2nd ed. Springer, 2011. (book)
End of Book 35. Next: Book 36 — Indoor Air Quality Monitoring with IoT.