← All 50 books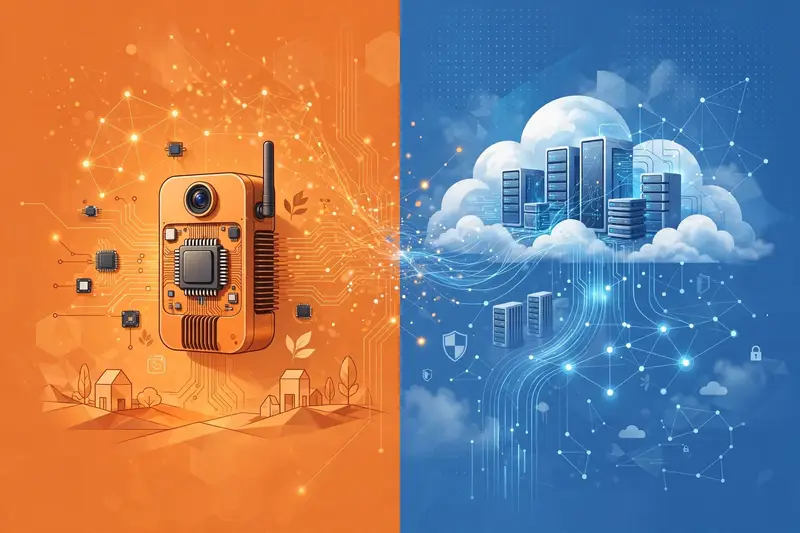
Book 33 of 50 · Free
Edge AI vs Cloud AI
3,201 words · 17 chapters · illustrated
Book 33 of 50 · Free
3,201 words · 17 chapters · illustrated
Book 33 of 50 — AstolixGen Learning Series For researcher and publication students
Where should intelligence live — on the device or in the cloud? This book gives you the full decision framework: latency, bandwidth, privacy, cost, and energy models for edge vs cloud AI, hybrid architectures that split the work, and how to evaluate the trade-off experimentally. You will learn to design the comparison studies that IoT and systems venues expect, and to justify your placement decision with numbers rather than slogans.
Learning objectives: - Model latency, bandwidth, cost, and energy for edge vs cloud - Identify workloads suited to edge, cloud, or hybrid placement - Design edge-cloud partitioning and early-exit architectures - Evaluate placement decisions experimentally - Account for privacy, regulation, and offline operation - Write a publishable edge-vs-cloud comparison study
Every AI system answers, explicitly or not: where does inference run? Cloud AI sends data to datacenters with effectively unlimited compute. Edge AI runs inference on local devices — from gateways and phones down to microcontrollers (TinyML, Book 32). The choice shapes everything: latency, cost structure, privacy posture, and what happens when the network fails.
The naive view is "cloud is powerful, edge is weak." The research view is a multi-objective optimization over constraints that differ per application. A voice assistant needs <300 ms response; a crop-yield predictor runs once a day. A hospital cannot send patient scans off-site; a social app already does. There is no universal answer — which is exactly why placement studies are publishable: the answer changes as hardware, networks, and models evolve.
Example: A factory vibration monitor sampling at 10 kHz generates 1.7 GB/day per machine. Cloud: $X/month in data transfer + 200 ms alert latency. Edge: $15 gateway per machine, 5 ms alerts, works during network outages. The edge wins on latency, reliability, and cost — but only because the data rate is high and the model is small.
For your research: State the placement decision as a function of measurable quantities (data rate, latency budget, model size, connectivity). "Edge vs cloud" papers that just assert are weak; ones that derive the crossover point are strong.
Key takeaway: Placement is a multi-objective optimization — derive the crossover, don't assert it.
Cloud inference latency = network uplink + queueing + inference + downlink. On a 4G link, the network alone is 50–150 ms each way; inference adds 10–100 ms. Edge inference latency = local inference only, typically 1–50 ms on gateways, sub-second on MCUs. For interactive applications (voice, AR, robotics control), the network round trip dominates and edge is mandatory. For batch analytics, latency barely matters and cloud wins on throughput.
Model it: measure each component separately. Use ping/iperf for network, and instrument inference time on both targets. Report percentiles (p50/p99), not means — tail latency is what users feel, and cloud tails are long (congestion, cold starts).
Example: Keyword spotting: cloud round trip p99 = 900 ms (kills usability); edge = 25 ms p99. Image classification for a daily report: cloud p99 = 1.2 s (irrelevant); edge would need a bigger device for no benefit.
For your research: A latency decomposition table (network vs inference, p50/p99, edge vs cloud) is a standard, expected figure in placement papers. Include cold-start effects for serverless cloud inference.
Key takeaway: Decompose latency into network + inference; report p99; the network round trip usually decides.
Bandwidth cost has two faces: money and feasibility. Money: cloud providers charge per GB ingested and per million inference requests; at high data rates, transfer dominates the bill. Feasibility: many deployments have no high-bandwidth link at all (LoRa, rural 2G, satellite) — sending raw sensor data is physically impossible, so edge processing isn't an optimization, it's a requirement.
"Data gravity" is the observation that large, continuously generated datasets pull computation toward themselves. A single 4K camera at 15 fps is ~150 GB/day; a hundred cameras is 15 TB/day. No reasonable budget moves that to the cloud in real time. Edge filtering (detect events locally, upload only clips) typically cuts data by 100–1000×.
Example: A traffic-monitoring study: 40 cameras → edge detection of vehicles (YOLO-tiny on Jetson) → upload only counts and 10-s event clips. Data reduced from 6 TB/day to 18 GB/day; cloud bill dropped 97%; detection latency fell from 2 s to 120 ms.
For your research: Quantify the data-reduction ratio of your edge filtering. "We reduce uplink data 340× while preserving 98.7% event recall" is a result.
Key takeaway: High data rates make edge mandatory; measure and report the reduction ratio.
Some data cannot leave the device — by law or by user expectation. Medical images (HIPAA/GDPR), children's voices (COPPA), factory trade secrets, and biometric data all face regulatory or contractual barriers to cloud processing. Edge AI keeps raw data local; only features, embeddings, or decisions cross the boundary.
The research angle: privacy is not binary. Techniques like federated learning (train across devices without centralizing data), split inference (run early layers on-device, send intermediate features), and differential privacy create a spectrum. Each has measurable costs: federated learning adds communication rounds; split inference still leaks information through features (model-inversion attacks are real).
Example: A cough-detection study for respiratory screening: raw audio never leaves the phone (regulatory requirement); the on-device model outputs a risk score; only anonymized scores with user consent reach the server. The paper's contribution included a privacy analysis alongside accuracy.
For your research: If your application touches personal data, include a privacy section: what data crosses the boundary, why, and what the alternatives cost. Reviewers in health and human-centered venues require it.
Key takeaway: Edge keeps raw data local — map your data flows and justify each boundary crossing.
Cloud AI costs are operational: per-request inference fees, data transfer, storage. They scale linearly with usage and are cheap to start. Edge AI costs are capital: devices, installation, maintenance — plus the hidden opex of fleet management (updates, failures, truck rolls). The crossover: at low volume cloud wins; at high volume edge wins; the exact point depends on your numbers.
Build the model: cloud_cost = requests × price_per_request + GB × transfer_price. Edge_cost = devices × (unit + install) + maintenance_per_year + (any cloud for aggregation). Solve for the request volume where they cross. Then stress-test assumptions: what if device lifetime is 3 years not 5? What if cloud prices drop 20%?
Example: Smart doorbell person-detection: cloud at $0.0015/request × 500 events/day × 10k homes = $2.7M/year. Edge: $8 NPU per doorbell × 10k = $80k capex + $50k/year maintenance. Edge wins by 30× at scale — but at 100 homes, cloud wins. The paper reported the crossover at ~400 homes.
For your research: A cost model with stated assumptions and sensitivity analysis is rare in papers and highly valued by industry-track reviewers. It turns a systems paper into a decision tool.
Key takeaway: Model capex vs opex, find the crossover volume, and stress-test your assumptions.
Energy analysis must span the whole path. Edge: device inference energy + sensor energy. Cloud: device radio energy (transmit the data!) + network infrastructure + datacenter inference. The radio is the swing factor: transmitting 1 MB over LTE costs ~1–5 J; running a small CNN on-device costs millijoules. For high-data-rate sensors, edge wins enormously; for tiny payloads (a temperature reading), the radio cost is negligible and cloud is fine.
Datacenter energy matters for carbon accounting: training is the headline cost, but at scale, inference dominates lifetime emissions. A paper that only reports device energy while ignoring the cloud side (or vice versa) is incomplete.
Example: Air-quality node: sending raw 1 Hz sensor data via LTE = 2.1 J/hour radio. On-device aggregation + hourly upload = 0.08 J/hour. Edge wins 26×. But for a node sending one 32-byte reading per hour, the difference is noise — cloud simplicity wins.
For your research: Always include the radio in edge-vs-cloud energy comparisons. The most common flaw in such papers is comparing device inference energy against datacenter inference energy while forgetting transmission.
Key takeaway: Count the radio — transmission energy usually decides edge vs cloud efficiency.
Pure edge or pure cloud is often suboptimal. Hierarchical inference: tiny model on-device filters; uncertain cases escalate to a bigger cloud model (e.g., wake-word on MCU → full ASR in cloud). Early exit: a single network with classification heads at multiple depths; easy inputs exit early on-device, hard ones continue in the cloud. Split computing: run the first layers on-device, send compressed features to the cloud — balances privacy, latency, and accuracy.
The design variable is the cascade threshold: too aggressive and the cloud is never used (wasted); too lax and everything escalates (no savings). Tune the threshold on validation data and report the operating curve (accuracy vs fraction escalated vs cost).
Example: Wildlife camera: on-device detector (92% recall, 3% of events are animals) → only animal candidates upload for cloud species classification. Cloud calls drop 97%, species accuracy 98%, total cost per camera-month $0.40 vs $11 pure-cloud.
For your research: Cascade/early-exit papers need the full operating curve, not a single point. Plot accuracy vs cost across thresholds — the curve is the contribution.
Key takeaway: Hierarchical and early-exit designs dominate pure placement — tune and report the operating curve.
Networks fail. Edge systems keep working; cloud systems degrade or die. For safety, industrial, medical, and remote applications, offline capability is a requirement, not a feature. Design for degraded modes: full function on-device, reduced function on cached models, graceful notification when cloud features are unavailable.
Measure resilience explicitly: what fraction of functionality survives 1 hour, 1 day, 1 week of disconnection? What is the recovery behavior (backlog upload storms can overwhelm the cloud on reconnect — design backpressure)?
Example: An offline-first clinic diagnostic: the on-device model handles 40 common conditions; rare conditions queue for cloud review when connectivity returns. During a 3-day outage, the clinic operated at 85% diagnostic coverage with zero data loss.
For your research: Resilience testing (chaos-style network partitions) is under-reported and impressive. "Our system maintained 92% functionality during a 24 h partition" is a strong systems result.
Key takeaway: Design for disconnection; measure degraded-mode coverage and reconnect behavior.
Map the spectrum: MCUs (Cortex-M, ESP32) — milliwatts, KB RAM, TinyML models. NPUs/TPUs on SBCs (Coral TPU, Jetson Nano/Orin) — watts, real-time vision, the sweet spot for serious edge AI. Phones — heterogeneous SoCs with NPUs, good for human-centric apps. Gateways/servers on-prem — "near edge," full Linux, GPUs optional. Cloud — unlimited, elastic.
The research implication: "edge" is not one thing. A Jetson Orin runs YOLOv8; a Cortex-M4 runs a 200 KB classifier. Papers must name the exact edge hardware — "we ran on the edge" is meaningless.
Example ladder for a retail analytics task: MCU: people counting via IR (no vision). Coral: object detection at 30 fps, 4 W. Jetson Orin: multi-camera tracking. Cloud: only for retraining and dashboards. Each rung justified by measurements in the paper.
For your research: If you claim an "edge" result, your hardware section must be precise enough for someone to buy the same board and reproduce. Include prices — cost is part of the edge argument.
Key takeaway: Name your edge hardware precisely — "edge" spans 5 orders of magnitude of compute.
A placement study needs: (1) the same task and model family on both sides (or justified different models), (2) identical metrics: task accuracy, p50/p99 latency, energy per inference (device + radio + estimated cloud), cost per 1k inferences, data transferred, offline coverage, (3) controlled network conditions (emulate 4G/weak links with tc), (4) multiple runs with variance.
Beware: comparing a quantized edge model against a full-precision cloud model confounds placement with compression — either compare same-precision or explicitly study the interaction. Also beware cloud cold starts and multi-tenancy noise; warm up and report variance.
Example matrix: 2 placements × 3 network profiles × 2 model sizes = 12 conditions; metrics as above; conclusion: "edge wins below 50 ms budgets and above 10 GB/day; cloud wins otherwise" — a decision rule, not just numbers.
For your research: The deliverable of a placement paper should be a decision rule or crossover analysis, not a winner declaration. That ages well as hardware changes.
Key takeaway: Control the network, match the models fairly, and produce a decision rule.
Placement isn't only about inference. Federated learning trains a shared model across devices without centralizing data: devices train locally, send updates, a server aggregates (FedAvg). Costs: communication rounds, stragglers, non-IID data hurting convergence. Split learning cuts the network: device trains early layers, server trains the rest — less device compute, but features sent to the server can leak private data.
For student research, federated learning is attractive: it's a hot topic, simulators exist (Flower, FedML), and you can run meaningful experiments without a device fleet. Honest limitations to report: communication cost vs accuracy, behavior under non-IID partitions (use Dirichlet splits), and privacy leakage of updates (gradient inversion is real).
Example: A keyboard next-word model federated across 100 simulated clients: reaches 90% of centralized accuracy with 40 rounds, but non-IID (per-user vocabulary) drops it to 82% — the non-IID gap is the finding.
For your research: Federated experiments must report the data partition scheme, rounds-to-accuracy, and communication cost. "We did federated learning and it worked" is insufficient.
Key takeaway: Federated/split learning move training to the edge — report partitions, rounds, and communication honestly.
Template:
Write it in IEEE format with the decision rule in the abstract. Related work must cover edge computing surveys, placement studies, and your application domain.
For your research: This maps to your assignments: problem + lit review (A1), method (A2), results (A3), presentation (A4). A placement study is an ideal semester-scale project.
Key takeaway: Question → crossover hypothesis → controlled comparison → decision rule + artifact = a publishable placement study.
| # | Chapter | Core idea | Research use |
|---|---|---|---|
| 1 | Placement question | Multi-objective, no universal answer | Derive crossovers |
| 2 | Latency | Network round trip dominates | p50/p99 decomposition |
| 3 | Bandwidth | Data gravity, reduction ratios | Report reduction ratio |
| 4 | Privacy | Data-boundary mapping | Privacy section for regulated domains |
| 5 | Cost | Capex vs opex crossover | Cost model + sensitivity |
| 6 | Energy | Count the radio | Full-path energy accounting |
| 7 | Hybrid | Cascades, early exit | Operating curves |
| 8 | Resilience | Degraded-mode coverage | Partition testing |
| 9 | Hardware | MCU→GPU spectrum | Precise hardware reporting |
| 10 | Evaluation design | Fair comparisons, decision rules | Controlled matrices |
| 11 | Federated/split | Training at edge | Partitions, rounds, comms |
| 12 | Study template | Question→rule→artifact | Assignment pipeline |
[1] W. Shi, J. Cao, Q. Zhang, Y. Li, and L. Xu, "Edge Computing: Vision and Challenges," IEEE Internet of Things Journal, vol. 3, no. 5, pp. 637–646, 2016. [2] M. Satyanarayanan, "The Emergence of Edge Computing," Computer, vol. 50, no. 1, pp. 30–39, 2017. [3] J. Lin et al., "MCUNet: Tiny Deep Learning on IoT Devices," in Proc. 34th Conf. Neural Information Processing Systems (NeurIPS), 2020. [4] C. R. Banbury et al., "MLPerf Tiny Benchmark," in Proc. 35th Conf. Neural Information Processing Systems (NeurIPS), Datasets and Benchmarks Track, 2021. [5] H. B. McMahan et al., "Communication-Efficient Learning of Deep Networks from Decentralized Data," in Proc. 20th Int. Conf. Artificial Intelligence and Statistics (AISTATS), 2017. [6] L. Atzori, A. Iera, and G. Morabito, "The Internet of Things: A survey," Computer Networks, vol. 54, no. 15, pp. 2787–2805, 2010. [7] S. Wolfert, L. Ge, C. Verdouw, and M. J. Bogaardt, "Big Data in Smart Farming — A review," Agricultural Systems, vol. 153, pp. 69–80, 2017. [8] World Health Organization, WHO Global Air Quality Guidelines, Geneva, 2021. [9] R. Roman, P. Najera, and J. Lopez, "Securing the Internet of Things," Computer, vol. 44, no. 9, pp. 51–58, 2011. [10] H. Kopetz, Real-Time Systems: Design Principles for Distributed Embedded Applications, 2nd ed. Springer, 2011. (book)
End of Book 33. Next: Book 34 — IoT Data Pipelines Explained.